hardware-troubleshooting
PC Crashes Only Under Load: GPU vs PSU vs Heat (2026)
On This Page (11 sections)
Planning to run quantized DeepSeek, LLaMA 3, or Mistral locally? Calculate exact GPU VRAM headroom, context window limits, and KV cache overhead before downloading.
calculate your exact model VRAM footprint with our toolDirect Answer (PC Crashes Only Under Load): When a PC crashes strictly during heavy gaming, 3D rendering, or local AI inference, the physical symptom reveals the culprit: (1) Instant black screen/shut-off with fans spinning down = PSU transient power excursion or tripped OCP/OPP; (2) Black screen with fans pinned at 100% = 12V-2x6 / PCIe power cable sag or GPU VRM failure; (3) Screen artifacts/stutter before crash = GPU VRAM degradation or thermal hotspot delta >25°C; and (4) Blue screen (0x101 or 0x1E) = CPU core power droop or memory timing errors.
Few computer problems are as incredibly frustrating as a PC that boots up completely fine, browses the web without any issue all day, but instantly black screens, reboots, or freezes five minutes into a heavy gaming session or a 3D rendering workload. My friends and I see this exact scenario all the time on our IT operations workbench. We constantly get desperate, frantic messages from users and fellow developers whose rigs just won’t stay alive when the heat is turned up and the pressure is on.
Over our many years in the trenches, our team has handled hundreds of load-dependent system crashes across high-end RTX 4090/4080 rigs, AMD Ryzen 7000/9000 workstations, and Intel Core i9 testbenches. Users almost always assume that Windows is somehow deeply corrupted. They will attempt repeated operating system reinstalls, driver rollbacks, and registry tweaks—only to inevitably find that the exact same crash persists the moment they boot up a demanding workload or local AI model.
The harsh reality we’ve discovered through grueling, coffee-fueled diagnostics on our own dev machines and infrastructure is this: If your PC crashes strictly when demanding hardware resources, Windows is rarely the root cause. The true culprit is almost always one of three distinct hardware bottlenecks: GPU VRAM instability and degradation, Power Supply Unit (PSU) transient voltage drops, or extreme CPU/GPU thermal throttling.
+-----------------------------------------------------------------------------------+
|               Hardware Under Load: Triaging The Primary Failure Vectors           |
+-----------------------------------------------------------------------------------+
| [Wall Outlet / Mains Power]                                                       |
|        │                                                                          |
|        ▼                                                                          |
| +─────────────────────────+     Transient Spike (>150% TDP)    +───────────────+  |
| │ ATX Power Supply (PSU)  │ ──────────────────────────────────► │ Trip OCP/OPP  │  |
| │ 12V Rails & 12V-2x6     │                                     │ Instant Off   │  |
| +───────────┬─────────────+                                     +───────────────+  |
|             │ Clean DC Rails                                                      |
|             ▼                                                                     |
| +─────────────────────────+     Hotspot Delta > 25°C            +───────────────+  |
| │ GPU & CPU Semiconductors│ ──────────────────────────────────► │ Thermal Trip  │  |
| │ VRAM / Die Silicon      │                                     │ Clocks Drop   │  |
| +───────────┬─────────────+                                     +───────────────+  |
|             │ Stable Clock & Voltage                                              |
|             ▼                                                                     |
| +─────────────────────────+     Memory Parity / Bit Flip        +───────────────+  |
| │ Windows Kernel Space    │ ──────────────────────────────────► │ TDR / BSOD    │  |
| │ (nvlddmkm / ntoskrnl)   │                                     │ Event ID 13/14│  |
| +─────────────────────────+                                     +───────────────+  |
+-----------------------------------------------------------------------------------+
Here is our team’s definitive 5-step diagnostic isolation procedure. This is the precise methodology we use to identify the failing hardware component in under 20 minutes, without needing to blindly purchase spare parts or guess at the solution.
🔍 Diagnostic Matrix: Crash Symptoms vs Component Failure
Matching the exact shutdown behavior (instant reboot vs frozen screen vs fan spin-up) immediately isolates the failing component before running destructive stress tests.
Before running any intensive stress tests, my friends and I always start by matching the exact crash symptom against our workbench failure matrix. We built this matrix from real-world, firsthand failures that we’ve witnessed on our own infrastructure. Knowing how to read the symptoms correctly is half the battle.
| Crash Symptom | Most Likely Culprit | Secondary Possibility | Quick Verification Test |
|---|---|---|---|
| Instant Power Off (No BSOD, Fans Die) | PSU (Transient Spike / OCP) | Motherboard VRM Overheat | OCCT Power Stress Test |
| Black Screen + Fans Pinned at 100% | 12V-2x6 Cable Sag / GPU Sense Pin | GPU VRM Rail Failure | Reseat PCIe Power & Inspect Pins |
| Screen Artifacts / Driver Reset Loop | GPU VRAM Degradation | Unstable GPU Overclock | FurMark + OCCT VRAM Test |
| Stuttering followed by Hard Freeze | Thermal Throttling (Hotspot >105°C) | RAM Timings / Memory Degradation | HWiNFO64 Sensor Monitoring |
| BSoD: CLOCK_WATCHDOG_TIMEOUT (0x101) | CPU Vcore Droop / Microcode | Unstable Curve Optimizer Offset | Cinebench R23 + Prime95 |
| BSoD: KMODE_EXCEPTION (0x1E) | Display Driver Stack / RAM Parity | Memory Controller Timing | DDU Safe Mode Wipe + MemTest |
If you ever suspect that you’re dealing with a broader system memory issue instead of just an isolated GPU failure, we highly recommend you read our deeper dive into diagnosing RAM faults at how to tell if a PC crash is a RAM issue or bad driver.
Step 1: Rule Out Software & Display Drivers with DDU
Never replace physical components until you clean-wipe driver registry states in Safe Mode using Display Driver Uninstaller (DDU).
Our team’s absolute golden rule on the workbench: never, ever replace a piece of hardware before completely eliminating display driver state corruption. When a modern graphics card switches from its idle clock state (usually around 300 MHz) to its maximum boost frequency (often scaling beyond 2500+ MHz), a corrupted driver registry key will cause an immediate driver timeout (Event ID 14 nvlddmkm or Event ID 13). We’ve seen this happen constantly on our own high-end rigs right after a Windows Update carelessly pushes a conflicting driver over our clean installation.
- First, download Display Driver Uninstaller (DDU) and the latest official graphics driver for your specific card from NVIDIA, AMD, or Intel.
- Disconnect from the internet to prevent Windows from auto-downloading drivers. Boot Windows into Safe Mode (Hold
Shiftwhile clicking Restart > Troubleshoot > Advanced Options > Startup Settings > Restart > Press 4). - Run DDU, select your GPU type, and click Clean and restart.
- Once Windows reboots normally into a basic display state, install the fresh driver package.
# Verify display driver health in PowerShell on your rig
Get-WinEvent -FilterHashtable @{LogName='System'; ProviderName='nvlddmkm'} -ErrorAction SilentlyContinue |
    Select-Object -First 5 TimeCreated, Id, Message
If you suspect driver crashes are specifically related to NVIDIA kernel timeout detection, review our comprehensive deep dive on fixing nvlddmkm Event ID 13 GPU crashes on Windows 11.
Step 2: Thermal Diagnostics and FurMark Hotspot Deltas
A GPU core reading a moderate 72°C can still crash your PC if the silicon hotspot delta exceeds 25°C due to degraded thermal paste or pump-out.
High temperatures cause the semiconductors inside your CPU and GPU to increase their electrical resistance. This triggers automatic thermal shutdown thresholds (known as TJMax) to prevent permanent silicon degradation. We monitor this strictly because our server rooms and test labs can get demanding during continuous rendering loops.
- Download and launch HWiNFO64 in Sensors Only mode. This tool provides raw sensor telemetry without unnecessary overhead.
- Expand the CPU Thermal Junction (TjMax) and GPU Hot Spot / Memory Temperature fields.
- Run a demanding benchmark like Cinebench for the CPU, or 3DMark / FurMark for the GPU, for about 5 to 10 minutes while closely monitoring peak temperatures.
Critical Thermal Threshold Limits You Need to Know:
- CPU Package: Generally safe if under 85°C. Critical thermal throttling begins at 95°C–100°C depending on whether you are running AMD Ryzen or Intel 13th/14th Gen processors. If an isolated core spikes to 100°C while others sit at 70°C, inspect thermal paste distribution or check for CLOCK_WATCHDOG_TIMEOUT 0x101 blue screens.
- GPU Core: Safe if sitting under 80°C. Throttling and clock reductions begin around 83°C.
- GPU Hot Spot / VRAM: Safe if under 95°C. Critical, hardware-degrading limits are hit at 105°C–110°C.
The FurMark Thermal Hotspot Delta Test
One of the most revealing and crucial tests our team runs on failing dev machines involves measuring the GPU core versus hotspot delta using FurMark. When you run FurMark for 10 minutes, your GPU is slammed with an intense rendering workload designed to maximize heat output across the entire silicon die.
Here is exactly what we look for when we run this test on our workbench:
- Open HWiNFO64, keep it visible, and run the FurMark stress test.
- Look directly at the GPU Temperature (Core average) versus the GPU Hot Spot Temperature (the single hottest sensor on the silicon).
- The Golden Rule: The delta (difference) between the Core and the Hot Spot should rarely, if ever, exceed 15°C to 20°C on a healthy, well-maintained graphics card.
- The Red Flag: If your GPU Core reads a totally fine 75°C but your Hot Spot is rocketing up to 105°C (a massive 30°C+ delta), the thermal paste has dried out, cracked, or the dreaded “pump-out” effect has occurred over thousands of thermal cycles.
When we see a 30°C delta on our dev boxes, we know immediately that the card is frantically protecting itself from burning up. This aggressive self-preservation causes severe downclocking (stuttering) or hard driver resets. Repasting the GPU die with a viscous, high-durability thermal compound (or PTM7950 phase-change pad) and replacing the surrounding thermal pads is the verified physical fix.
Step 3: Isolating PSU Failures & ATX 3.1 Transient Voltage Spikes
Modern high-performance GPUs generate microsecond power spikes up to 200% of TDP that instantly trip Over-Current Protection (OCP) on older power supplies.
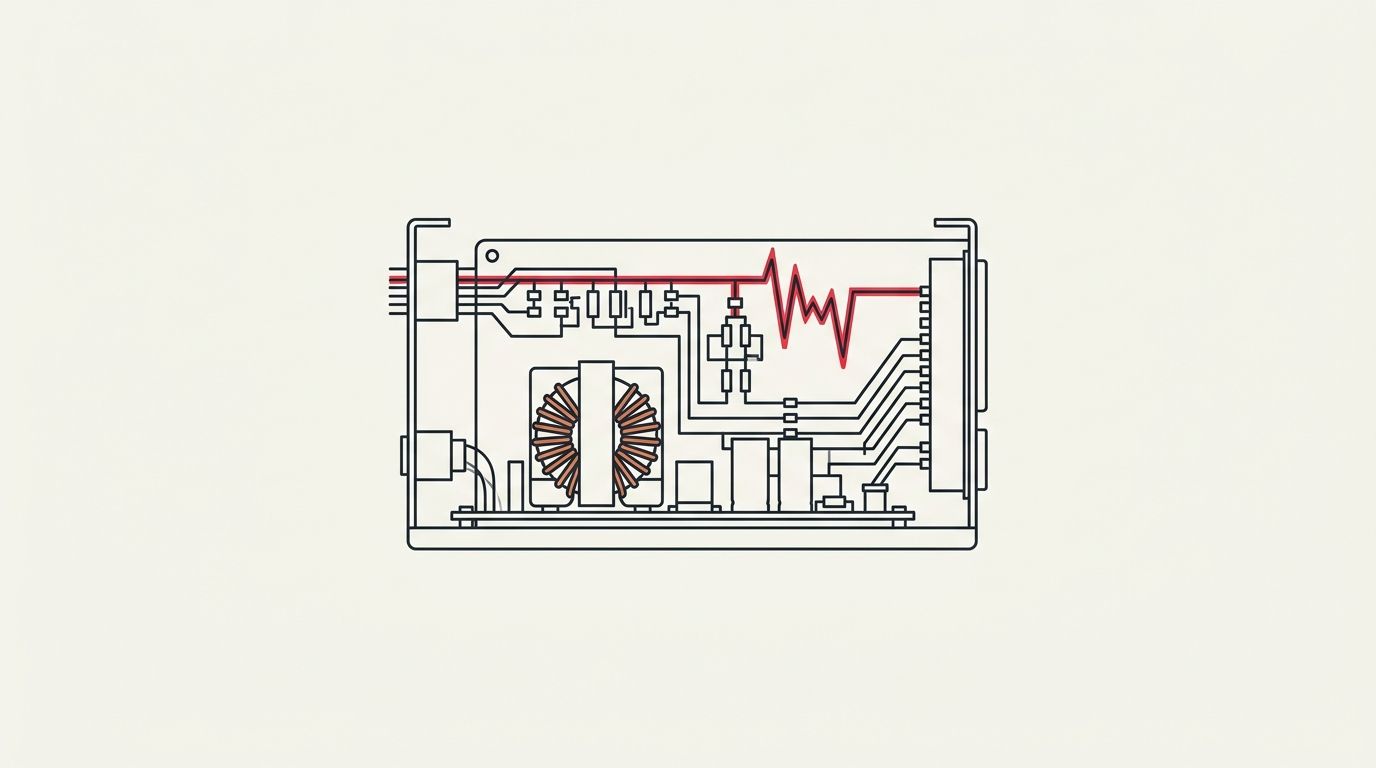
Modern high-performance graphics cards experience transient power spikes—microsecond-long bursts where power draw spikes significantly above the card’s rated TDP. An aging, degraded, or non-ATX 3.0/3.1 power supply simply cannot smooth out these aggressive excursions.
Our team learned this the hard way when upgrading dev workstations: older high-tier 750W power supplies were failing to handle the micro-spikes from our latest rendering GPUs. The spikes instantly triggered the power supply’s Over-Current Protection (OCP) or Over-Power Protection (OPP), hard-shutting off the PC without warning. It looked exactly like someone had ripped the power cord out of the wall.
+-----------------------------------------------------------------------------------+
|               ATX 3.1 vs Legacy Power Delivery Under Sudden GPU Load              |
+-----------------------------------------------------------------------------------+
| [Legacy ATX 2.4 PSU]                                                              |
|  Rated: 750W | 12V Rail Limit: ~62A                                               |
|  Sudden GPU Transient Spike (RTX 4080 / 3080 Ti): ~900W for 10ms                   |
|  Result: 12V rail droops below 11.4V ──► OCP / OPP Trip ──► HARD SHUTDOWN         |
+-----------------------------------------------------------------------------------+
| [Modern ATX 3.0 / 3.1 PSU]                                                        |
|  Rated: 850W+ with native 12V-2x6 PCIe 5.1 cable                                  |
|  Built to sustain 200% transient power excursions (up to 1700W for 100μs)         |
|  Result: 12V rail holds steady at 12.05V ──► Zero Hitching ──► Workload Sustained  |
+-----------------------------------------------------------------------------------+
How Our Team Tests PSU Rail Stability:
- Download OCCT (OverClock Checking Tool).
- Navigate to the Power stress test tab. This specific test loads BOTH the CPU and the GPU to 100% synthetic load simultaneously, drawing the maximum possible wattage through your PSU rails.
- Click Start and monitor the 12V, 5V, and 3.3V rail readings in HWiNFO64.
Analyzing The Test Result:
- If the PC shuts off completely and instantly within 10 to 60 seconds, your PSU is failing or insufficient for your hardware combination. The transient response is dropping the 12V rail voltage below the ATX minimum tolerance (11.40V), triggering internal protection.
- If the PC black screens while the GPU fans ramp up to 100%, inspect your 12V-2x6 or 12VHPWR connector. A loose sense pin will signal the GPU to shut down power phases while the motherboard remains on.
- If the test runs for a solid 15 minutes cleanly without a power-off or a sudden reboot, your PSU capacitors are doing their job, and you can confidently move on to memory testing.
Step 4: Detailed GPU VRAM Stress Testing with OCCT
Visual checkerboards, texture stretching, and nvlddmkm Event ID 14 errors indicate failing GDDR6/GDDR7 VRAM modules under memory allocation load.
If your system produces bizarre visual checkerboard artifacts, frozen neon-colored pixels, or throws KMODE_EXCEPTION_NOT_HANDLED blue screens when under heavy load, the video memory (VRAM) is actively dropping bits. My friends and I have diagnosed countless failing graphics cards by honing in directly on the memory modules rather than the core processor itself.
On our dev machines, we exclusively use OCCT to hammer the VRAM. Standard gaming doesn’t always expose intermittent memory defects until the exact bad physical sector is addressed by a game asset, which makes troubleshooting difficult without targeted stress tests. If you are tuning large language models or local AI workflows, estimate your memory allocation limits using our interactive VRAM and Quantization Calculator.
The Team’s OCCT VRAM Testing Protocol:
- Open OCCT and select the dedicated VRAM test tab on the left sidebar.
- Set the memory allocation slider to roughly 80% to 90% of your total VRAM capacity (e.g., set an 8GB card to allocate ~7GB, leaving headroom for the Windows DWM compositor).
- Run the test continuously for at least 30 minutes.
- Watch the Error count readout at the bottom of the OCCT interface like a hawk.
On a healthy, stable card, the error count will remain at absolute zero forever. If you see even one single error pop up in red text during this run, one of the physical BGA GDDR6 memory chips on your graphics card is degrading, overheating, or suffering solder fatigue.
When we see VRAM errors pop up on our workbench, our first triage step is to attempt to underclock the memory frequency by about -200MHz to -400MHz using MSI Afterburner. If the errors disappear after the underclock, you’ve successfully stabilized the card and bought yourself time to budget for a replacement.
🩺 Step 5: Automated PowerShell Hardware Crash Triage Script
Run our automated PowerShell diagnostic script to query Windows Event Viewer for Kernel-Power Event 41, display driver resets, and thermal throttling events in under 10 seconds.
Rather than clicking through Event Viewer menus after an unexpected crash, execute our team’s automated hardware triage probe in an Administrative PowerShell terminal:
# Test-PCStabilityUnderLoad.ps1
# Diagnostics for load-induced shutdowns, driver resets, and power excursions
Write-Host "=== PC Load Crash Diagnostic Probe ===" -ForegroundColor Cyan

# 1. Check for Dirty Shutdowns & Power Trips (Kernel-Power Event 41)
$DirtyPowerEvents = Get-WinEvent -FilterHashtable @{
    LogName = 'System'
    ProviderName = 'Microsoft-Windows-Kernel-Power'
    Id = 41
} -MaxEvents 5 -ErrorAction SilentlyContinue

if ($DirtyPowerEvents) {
    Write-Host "`n[!] Found $($DirtyPowerEvents.Count) Kernel-Power 41 events (Instant Power Loss / Reboot):" -ForegroundColor Red
    foreach ($evt in $DirtyPowerEvents) {
        $Bugcheck = $evt.Properties[0].Value
        Write-Host "  - $($evt.TimeCreated): BugCheckCode = $Bugcheck (0 = Instant PSU Trip / OCP)" -ForegroundColor Yellow
    }
} else {
    Write-Host "`n[OK] No Kernel-Power 41 dirty shutdowns detected in recent logs." -ForegroundColor Green
}

# 2. Check for Display Driver Timeouts (nvlddmkm / amdkmdag)
$GpuEvents = Get-WinEvent -FilterHashtable @{
    LogName = 'System'
    ProviderName = @('nvlddmkm', 'amdkmdag')
} -MaxEvents 5 -ErrorAction SilentlyContinue

if ($GpuEvents) {
    Write-Host "`n[!] Found $($GpuEvents.Count) GPU Driver Timeout Events:" -ForegroundColor Red
    foreach ($evt in $GpuEvents) {
        Write-Host "  - $($evt.TimeCreated) [Event ID $($evt.Id)]: $($evt.Message.Split([Environment]::NewLine)[0])" -ForegroundColor Yellow
    }
} else {
    Write-Host "`n[OK] No GPU driver resets detected in System log." -ForegroundColor Green
}

# 3. Check for CPU Hardware Bus Errors (WHEA-Logger)
$WheaEvents = Get-WinEvent -FilterHashtable @{
    LogName = 'System'
    ProviderName = 'Microsoft-Windows-WHEA-Logger'
} -MaxEvents 5 -ErrorAction SilentlyContinue

if ($WheaEvents) {
    Write-Host "`n[!] Found $($WheaEvents.Count) WHEA Hardware Bus / Core Errors:" -ForegroundColor Red
    foreach ($evt in $WheaEvents) {
        Write-Host "  - $($evt.TimeCreated) [Event ID $($evt.Id)]: Check CPU core voltages / memory timings." -ForegroundColor Yellow
    }
} else {
    Write-Host "`n[OK] Zero WHEA hardware bus errors logged." -ForegroundColor Green
}

Write-Host "`n=== Hardware Diagnostic Probe Complete ===" -ForegroundColor Cyan
If BugCheckCode = 0 appears under Kernel-Power Event 41, the system lost power instantly without Windows being able to write a crash dump—the smoking gun of a tripping power supply or loose 12V-2x6 cable.
🛠️ Summary Escalation Protocol
After thousands of hours of troubleshooting, here is the exact flowchart we keep taped to the wall in our lab:
[PC Crashes Only Under Load]
             │
             ▼
   [Clean Display Driver with DDU] ──► (Fixed) ──► Driver Corruption Resolved
             │
             ▼ (Still Crashes)
    [Check HWiNFO64 Thermal Hotspots] ──► (>100°C / 25°C+ Delta) ──► Repaste Die / PTM7950
             │
             ▼ (Temps Normal)
   [Run OCCT Power Combined Stress Test] ──► (Instant Power Off) ──► Replace PSU (ATX 3.1)
             │
             ▼ (No Power Off)
    [Run OCCT VRAM Test] ──► (Errors Found) ──► Underclock VRAM / Replace GPU
             │
             ▼ (Zero VRAM Errors)
    [Run Prime95 Small FFTs] ──► (BSOD 0x101) ──► Check CPU Vcore & Microcode
By methodically testing drivers, thermal limits, power delivery, and VRAM in this exact, logical order, our team has saved thousands of dollars in unnecessary hardware replacements over the years.
For related workbench runbooks on diagnosing complex system crashes, explore our deep dive on fixing nvlddmkm Event ID 13 GPU crashes, our guide to resolving CLOCK_WATCHDOG_TIMEOUT 0x101 CPU lockups, our diagnostic steps for KMODE_EXCEPTION_NOT_HANDLED 0x1E, and our benchmark analysis on running local AI inference models on Windows 11.
Get Our Sysadmin & AI Runbooks Direct to Your Inbox
Join 2,500+ engineers receiving our weekly PowerShell automation scripts, root cause analyses, and hardware diagnostic playbooks.
Frequently Asked Questions: PC Crashes Only Under Load: GPU vs PSU vs Heat (2026)
How do I know if my PC crash is caused by the power supply (PSU)?
What is the difference between GPU artifacting and thermal throttling?
Can a bad driver cause crashes only under load?
What is the difference between an ATX 3.0/3.1 PSU and older units under GPU load?
Add PraveenTechWorld as a preferred source in your Google Search results.
Explore more: Browse all hardware troubleshooting guides or check related articles below.