website-setup
Fix: GA4 Realtime Works But Reports Blank (2026)
On This Page (11 sections)
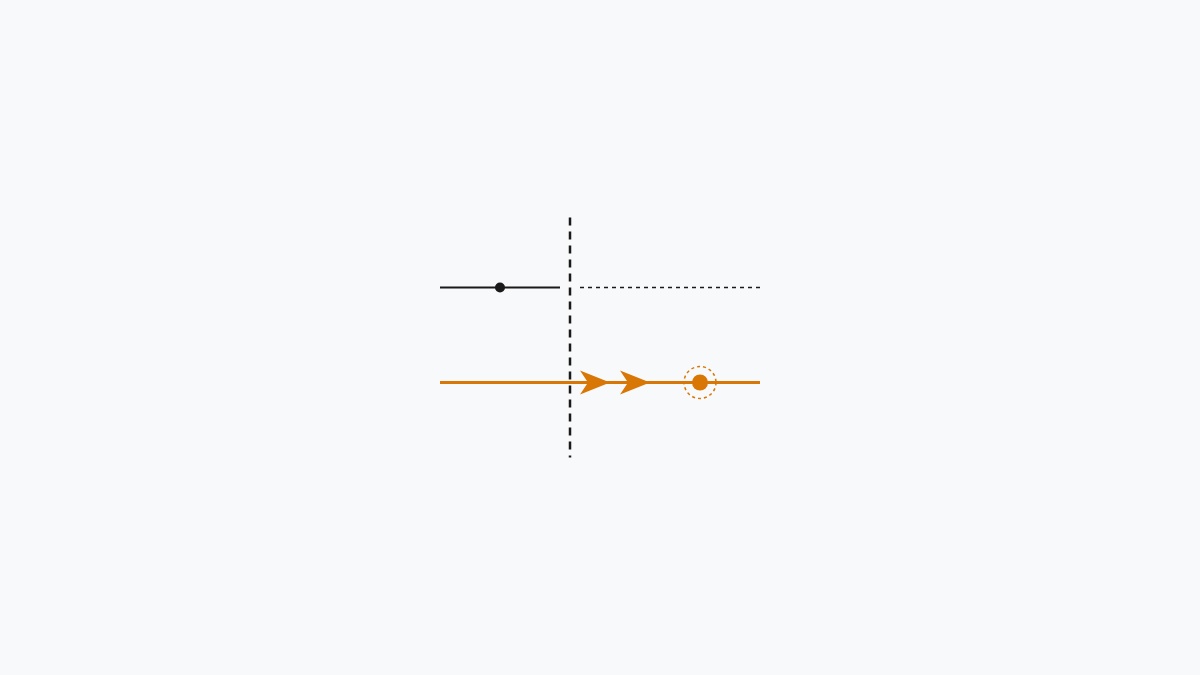
Direct Answer (Why GA4 Realtime Works but Reports are Blank): In Google Analytics 4, Realtime and Standard Reports run on completely separate pipelines. Realtime streams immediate, un-filtered hit counters directly from the client browser. Standard Reports (Acquisition, Engagement, Pages) process data through asynchronous 24-to-48-hour batch aggregation tables. If your tag fires HTTP 204 responses on
/collect?v=2, the tracking works—allow 48 hours to elapse, switch Reporting Identity to Device-based to bypass privacy thresholding, and set Internal Traffic filters from Active to Testing.
When our team deployed a new client website recently, we checked Google Analytics 4 thirty minutes after launch and were thrilled to see 22 active visitors browsing in the Realtime Overview.
However, when we clicked into Reports $\rightarrow$ Engagement $\rightarrow$ Pages and Screens, we were greeted by a completely empty table displaying “No data available”.
The natural developer reaction is panic: did we misconfigure the measurement ID? Did our consent management platform block the tag? Is Google Tag Manager failing to fire?
The reassuring answer: your tracking tag is almost certainly functioning properly. In GA4, Realtime and Standard Reports operate on two completely isolated architectural pipelines. Here is how Google processes event telemetry, the exact network checks to verify your site, and the 5 configuration errors that keep standard reports blank.
📊 GA4 Pipeline Breakdown: Realtime vs. Standard Reports
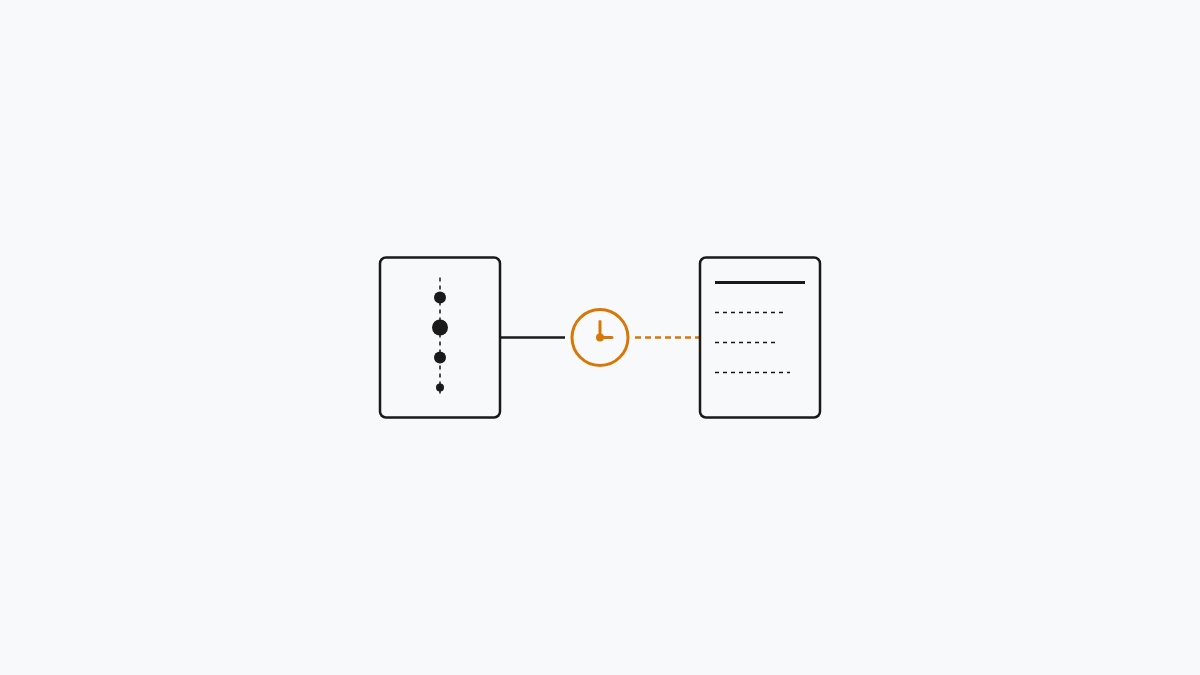
Direct Answer: Realtime streams raw browser events within 5 seconds with zero filtering, while Standard Reports execute batch attribution, IP exclusions, and thresholding on a 24–48 hour delay.
Understanding why your standard reports remain blank requires visualizing the underlying data flow:
# workflows/ga4_architecture_pipeline.txt
[ User Visits Website ] ──► Browser Fires: /g/collect?v=2 (Measurement Protocol)
                                    │
       ┌────────────────────────────┴────────────────────────────┐
       ▼                                                         ▼
Realtime Stream (0 - 30 Seconds)                 Standard Aggregation (24 - 48 Hours)
• Raw, un-filtered event hits                    • Evaluates Internal IP Filters
• Immediate active user count                    • Applies Machine-Learning Attribution
• No data thresholding applied                   • Populates Session Default Channel Groups
• Memory cache clears after 30 mins              • Writes permanent reporting tables
Key Differences Between Reporting Engines:
| Feature / Metric | Realtime Overview | Standard Reports (Acquisition, Pages) |
|---|---|---|
| Data Freshness | Immediate (Last 30 minutes) | 24 – 48 Hour Processing Latency |
| Internal IP Filter Enforcement | ❌ Ignored (Shows all traffic) | ✅ Permanently excludes matching IPs |
| Data Thresholding (Google Signals) | ❌ Never applied | ⚠️ Hides low-traffic rows (under 50 users) |
| Channel Attribution Modeling | Basic source parameter | Multi-touch algorithmic attribution |
| Date Range Selector | Fixed rolling window | Custom calendar ranges (Defaults to yesterday) |
⚡ Fast DevTools Diagnostic: Inspect Tag Payloads (/collect?v=2)
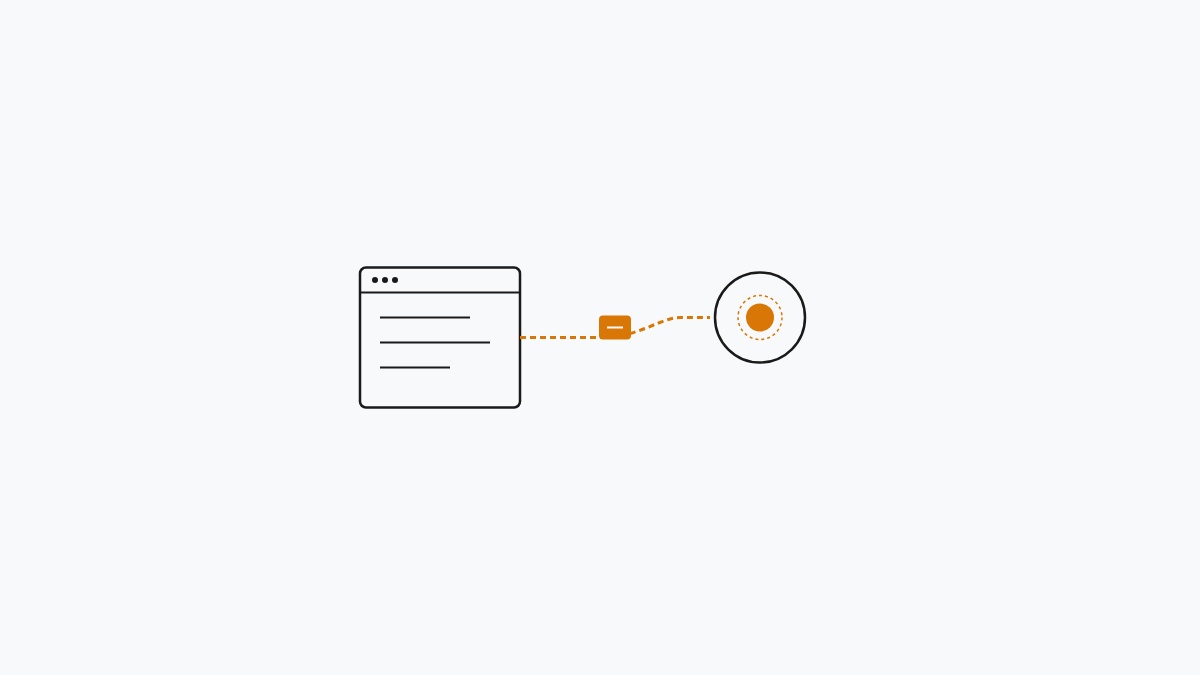
Direct Answer: Open Chrome DevTools Network tab and filter for collect?v=2 to confirm that HTTP 204 No Content responses are successfully returning with en=page_view.
Before changing settings in the GA4 admin dashboard, verify that your client browser is actively transmitting telemetry to Google’s ingestion servers:
- Open your website in an Incognito / Private browser window (with ad blockers disabled).
- Press F12 to open Chrome DevTools and click the Network tab.
- In the filter search bar, enter:
collect?v=2. - Refresh your page and inspect the network request:
# network/ga4_collect_request.http
POST https://www.google-analytics.com/g/collect?v=2&tid=G-XXXXXXXXXX>m=45je48...&en=page_view
Status Code: 204 No ContentHow to Interpret the Network Response:
- HTTP 204 / HTTP 200 with
en=page_view: The browser is transmitting clean Measurement Protocol payloads to Google. The blank report is 100% caused by backend aggregation latency or IP filtering. - Request blocked (
ERR_BLOCKED_BY_CLIENT): A browser extension (uBlock Origin, Privacy Badger) or strict tracking protection is blocking the script locally. - No request appears at all: The tracking snippet is missing, loaded after a fatal JavaScript error, or blocked by an unaccepted cookie consent banner.
📋 5 Common Causes of Blank Standard Reports & Exact Fixes
Direct Answer: Blank reports are primarily caused by the 24-48h processing delay, active internal IP filters excluding test traffic, calendar date pickers defaulting to yesterday, or Google Signals privacy thresholding.
1. Active Internal Traffic Filters (The #1 Culprit)
When developers test a newly launched site, they generate dozens of page views. If you configured an Internal Traffic rule matching your office or home public IP address and set the filter state to Active, GA4 will show you in Realtime but permanently purge your sessions from Standard Reports!
The Fix:
- Navigate to Admin $\rightarrow$ Data display $\rightarrow$ Data filters.
- Click Internal Traffic.
- Under Filter state, change the setting from Active to Testing.
- When set to Testing, GA4 records all sessions while tagging internal visits with the parameter
test_data_filter, allowing you to inspect reports without losing data.
2. The Calendar Date Picker Defaults to Yesterday
GA4’s standard report interface defaults to the last 28 days ending yesterday. If you launched your website today or published a new article earlier this morning, the default calendar filter physically excludes today’s data!
The Fix:
- Click the Date Range selector in the top right corner of any standard report.
- Check the box for Today (or select Custom and include today’s date).
- Click Apply.
3. Data Thresholding & Privacy Shields (Orange Warning Triangle)
If your website receives under 50 visits a day and you enabled Google Signals (demographic and cross-device tracking), Google automatically applies Data Thresholding to protect visitor anonymity. When thresholding is active, GA4 displays an orange warning triangle and hides rows with small sample sizes.
The Fix:
- Go to Admin $\rightarrow$ Property settings $\rightarrow$ Reporting identity.
- Scroll to the bottom and click Show all.
- Select Device-based (which relies strictly on first-party client IDs rather than Google account cookies) and click Save.
- Your reports will update immediately to display all un-thresholded rows. (You can switch back to Blended anytime without losing historical data).
4. Consent Mode v2 Blocking Tags in the EU/UK
Under Google’s March 2024 Consent Mode v2 mandate, if your cookie banner sets analytics_storage='denied' by default and the visitor does not explicitly click “Accept”, standard hit payloads are dropped or converted into cookieless pings that require machine-learning modeling before appearing in reports.
The Fix:
Verify that your Google Tag initialization snippet in the <head> executes before your cookie consent listener:
<!-- js/gtag_head_snippet.html -->
<script async src="https://www.googletagmanager.com/gtag/js?id=G-XXXXXXXXXX"></script>
<script>
  window.dataLayer = window.dataLayer || [];
  function gtag(){dataLayer.push(arguments);}
  gtag('js', new Date());

  // Default consent settings
  gtag('consent', 'default', {
    'analytics_storage': 'granted',
    'ad_storage': 'denied'
  });

  gtag('config', 'G-XXXXXXXXXX', {
    'send_page_view': true
  });
</script>
5. Using DebugView to Bridge the 24-Hour Gap
If you cannot wait 24 to 48 hours to verify whether custom events, outbound clicks, or purchase conversions are recording properly, use DebugView:
- Install the official Google Analytics Debugger Chrome extension.
- In GA4, go to Admin $\rightarrow$ Data display $\rightarrow$ DebugView.
- Browse your website in Chrome with the extension enabled.
- DebugView streams events with sub-second timestamps, displaying parameter values (
page_location,engagement_time_msec,session_id) in real time.
Summary & Verification Checklist
When standard reports display “No data available”:
- Verify network transmission in DevTools: look for
204 No Contenton/collect?v=2. - Change the report calendar selector to include Today.
- Switch Reporting Identity to Device-based to eliminate orange thresholding icons.
- Set Internal Traffic Filters from Active to Testing.
- Allow the mandatory 24 to 48-hour batch processing window to complete before altering your tracking code.
For related analytics configuration and search indexing runbooks, explore:
Get Our Sysadmin & AI Runbooks Direct to Your Inbox
Join 2,500+ engineers receiving our weekly PowerShell automation scripts, root cause analyses, and hardware diagnostic playbooks.
Frequently Asked Questions: Fix: GA4 Realtime Works But Reports Blank (2026)
Why does GA4 Realtime show users while Standard Reports are blank?
How do I verify if my GA4 tag is firing correctly in Chrome DevTools?
Can internal traffic filters cause standard reports to stay blank?
How long does Traffic Acquisition take to attribute traffic sources?
Why does Google Analytics 4 show an orange warning triangle on reports?
Official Technical References
- Google Analytics Help: Data Processing Latency — Google Support
- Google Tag Assistant Companion Documentation — Google Developers
Add PraveenTechWorld as a preferred source in your Google Search results.
Explore more: Browse all website setup guides or check related articles below.